
 Written by
 What if the ride to work could help make a city safer? DATA-RIDE is a citizen science and urban advocacy initiative developed within LAUDS Factories, in collaboration with Université de Lorraine and the Lorraine Smart Cities Living Lab (LSCLL) in Nancy. At its heart is a simple question: how can everyday cycling experiences become evidence for public discussion and better mobility decisions?
This first half of the year, the project reached a major milestone in citizen engagement. In mid-February, GIG members Artur Kim Shum and Laura Sobral travelled to Nancy to hold a community workshop and launch the first round of citizen-generated data collection with local cyclists using the open-source senseBox:bike. In May, the team shared the results with the community.
But the DATA-RIDE project is not only about collecting data, it is about what happens next. How can citizen-generated evidence be interpreted together with cyclists, researchers and local stakeholders, and then translated into maps and advocacy resources? The first workshop was where that participatory process began. Get to know how the DATA-RIDE team rode through its first foray into citizen engagement.
Part 1: Community engagement workshop
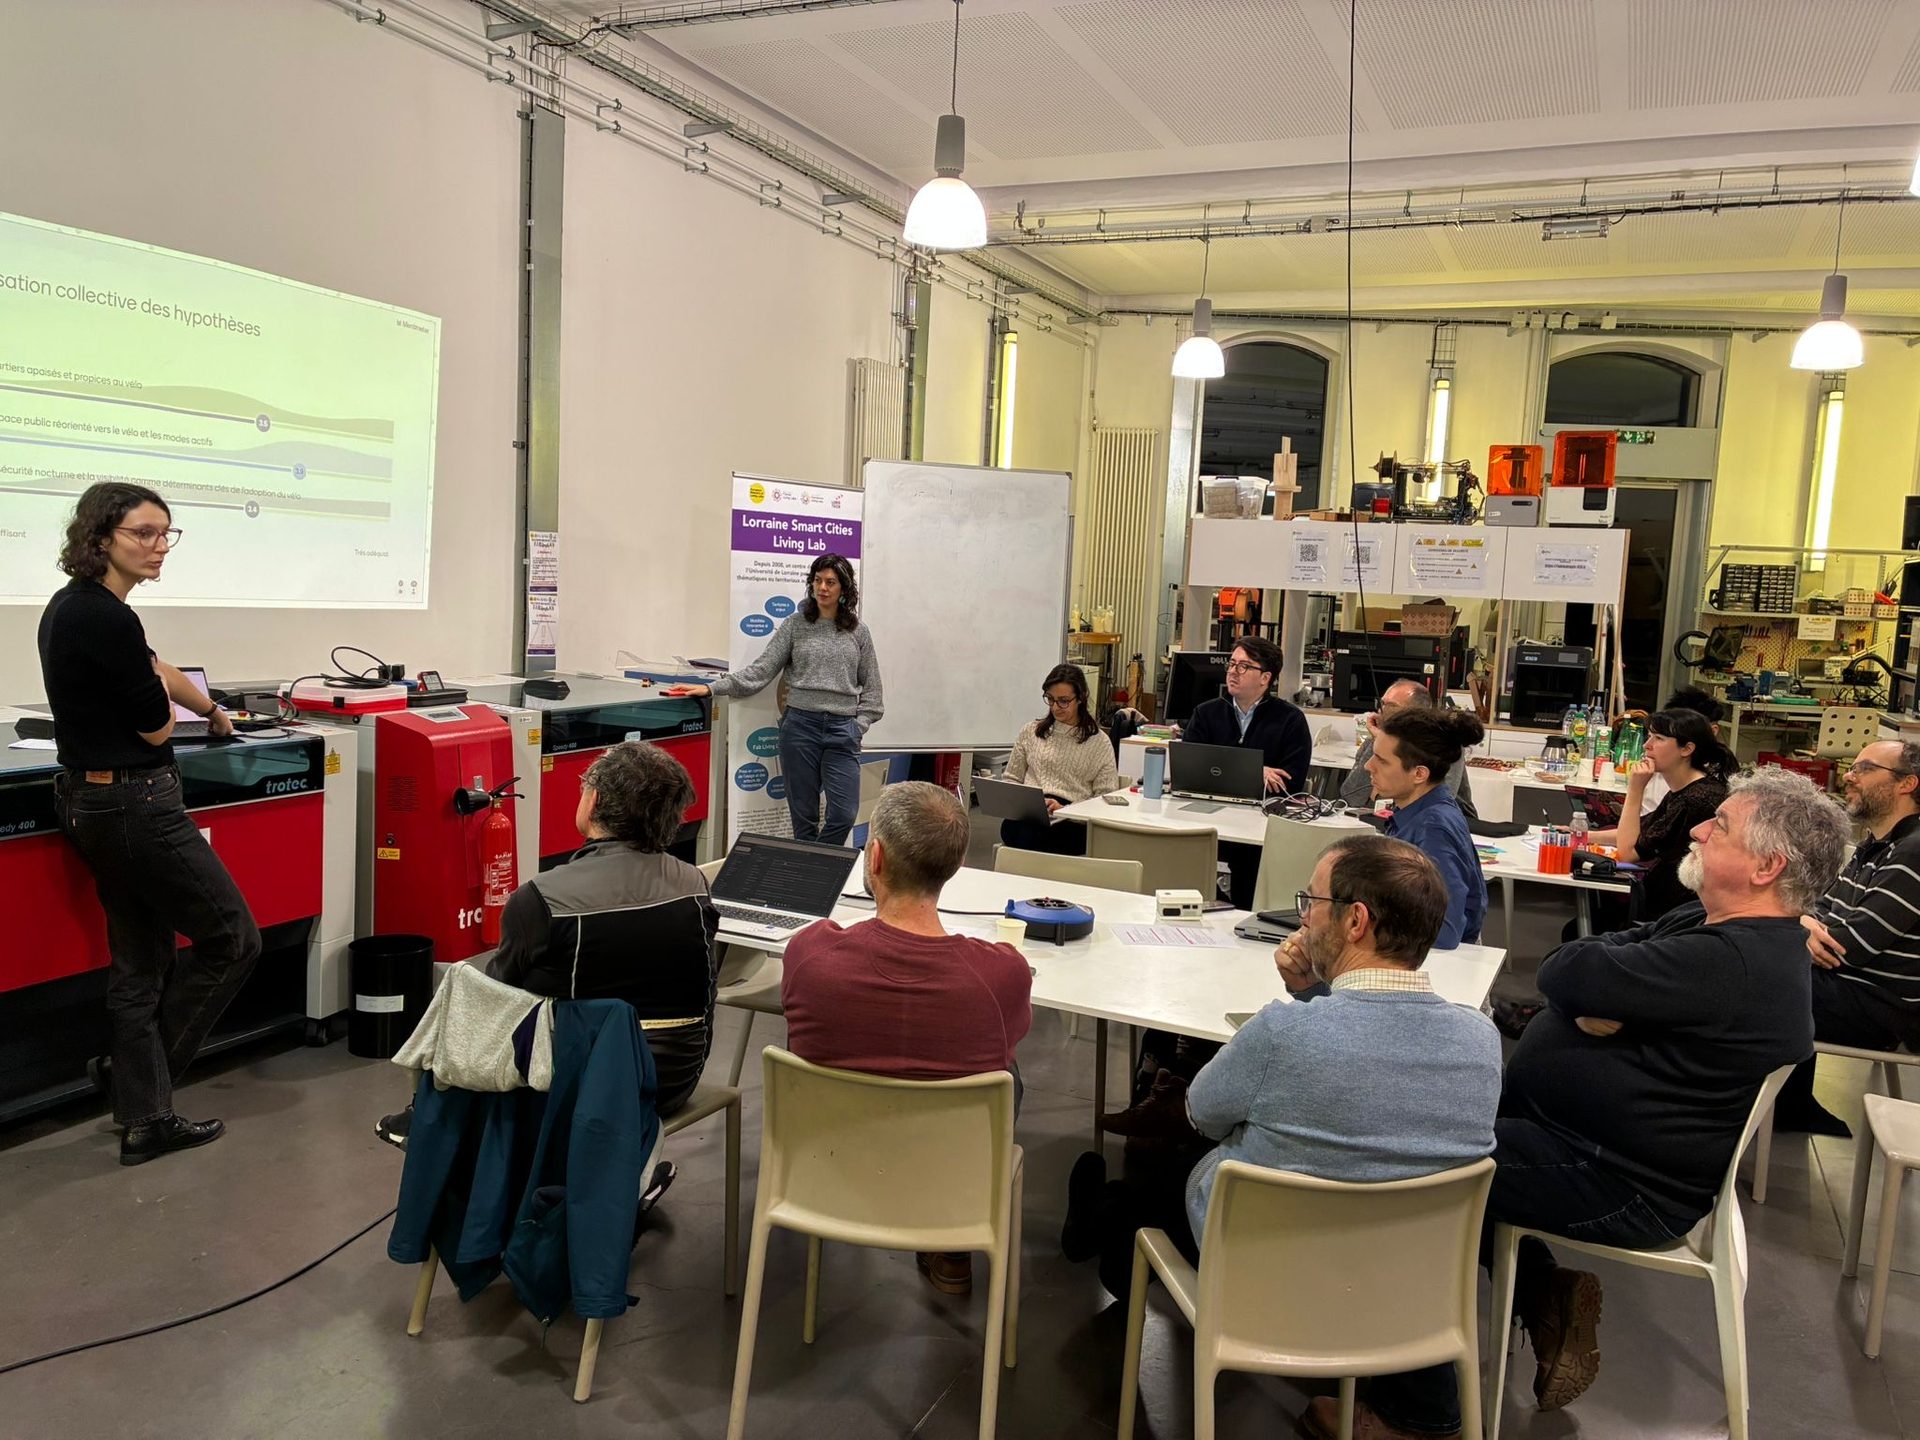
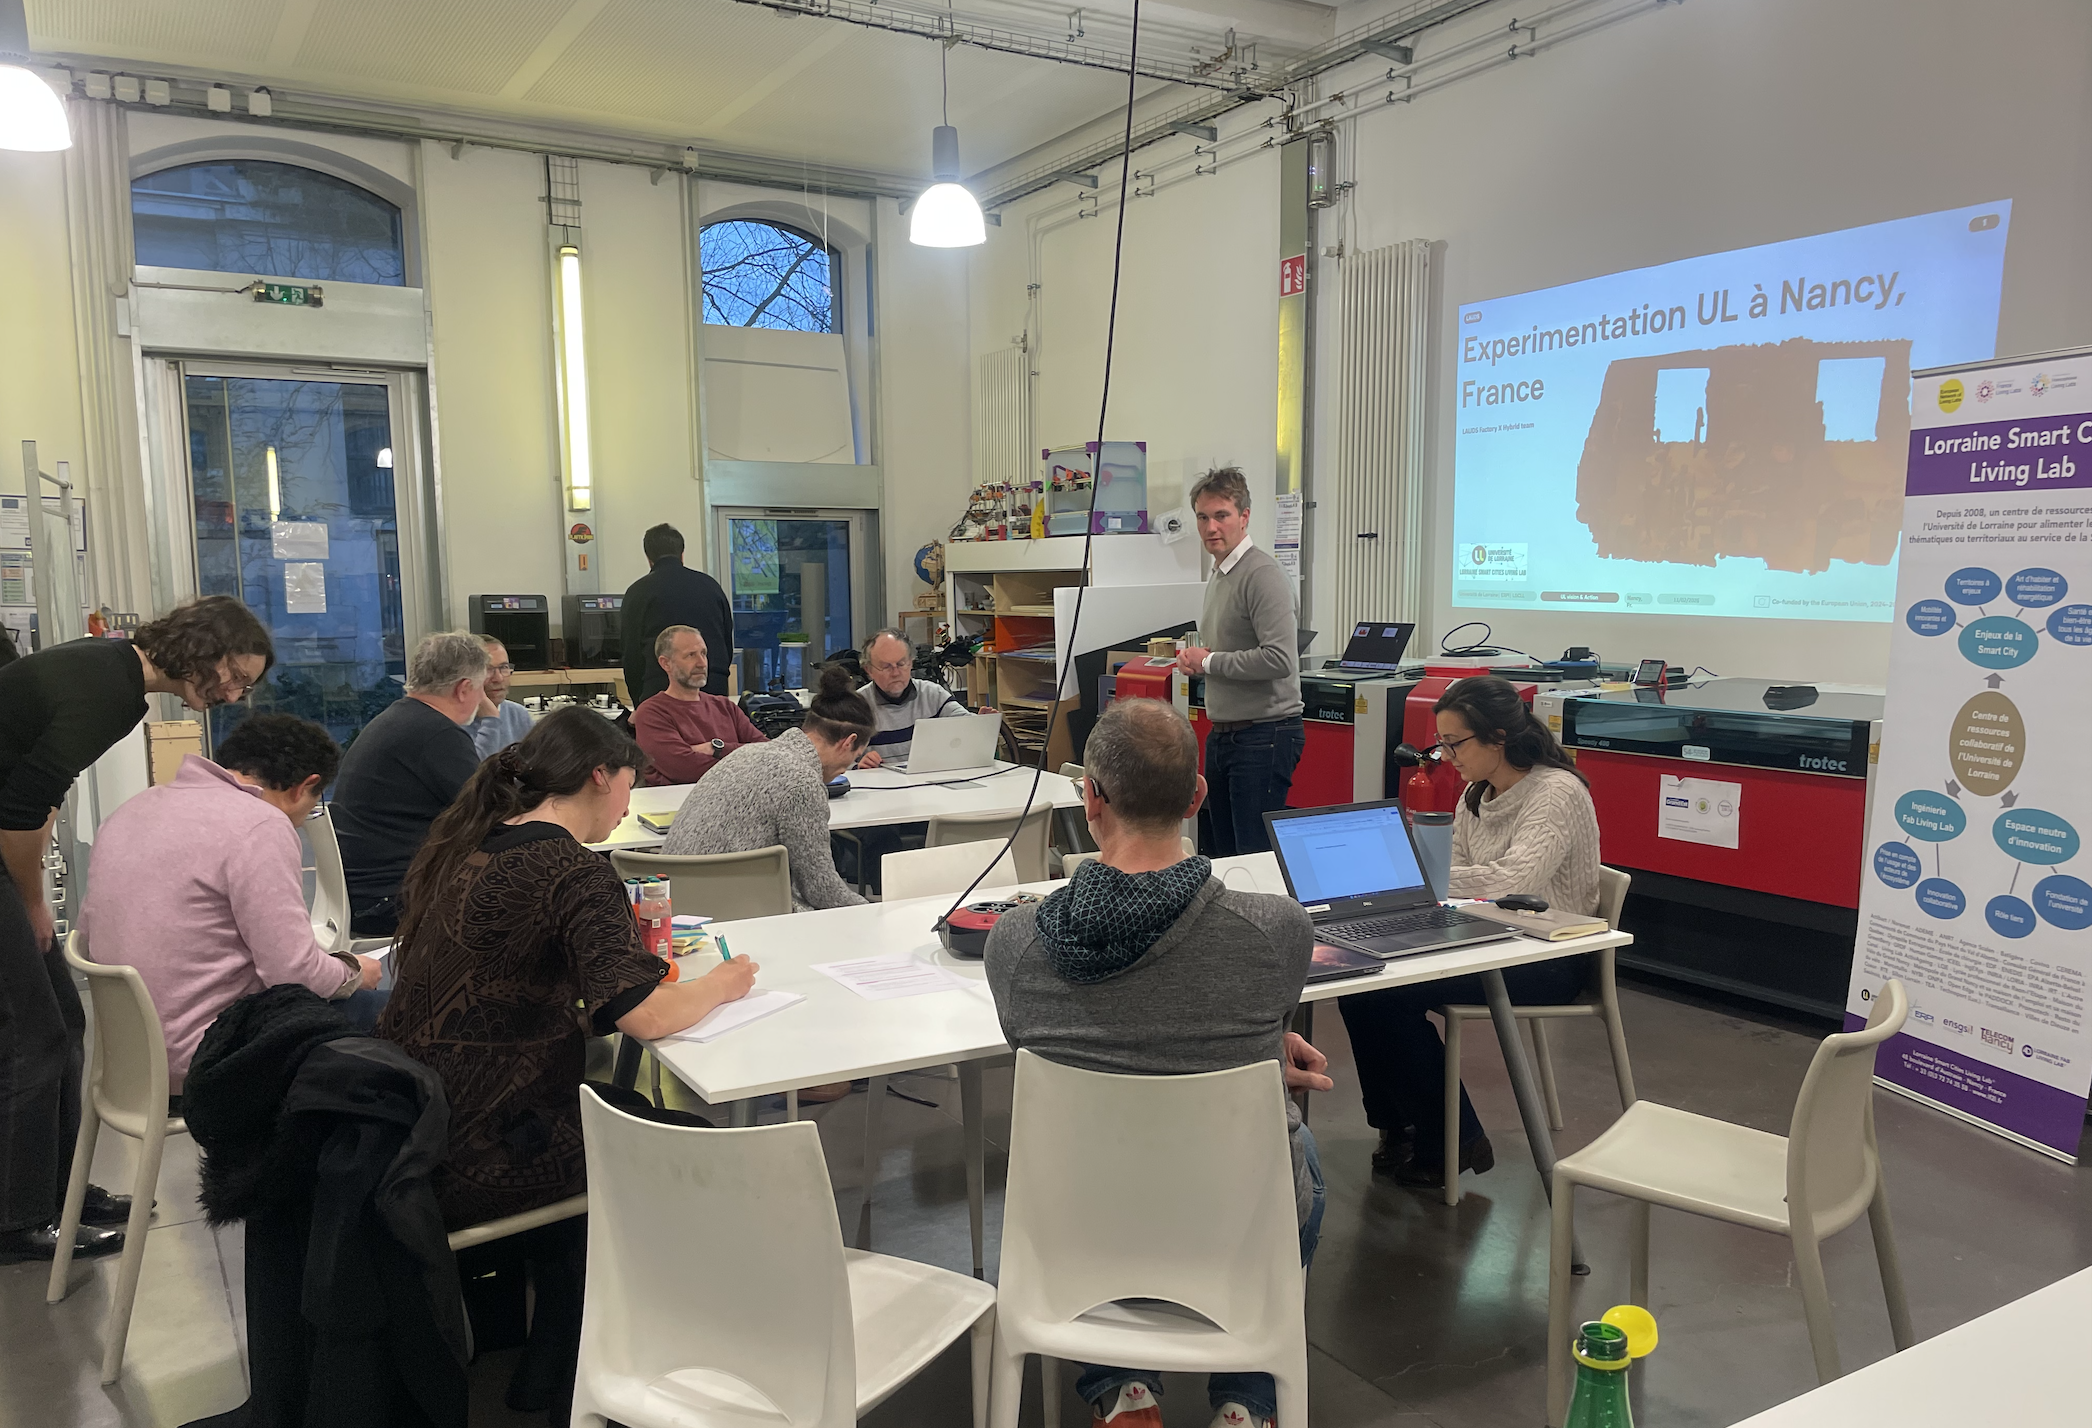
During the community engagement workshop in February, the team gathered with participating cyclists and local community organisations who talked about their own experiences and the issues they wanted to investigate using data sensors. Adopting a problem-solution approach, the team started from these issues rather than from what the technology happened to measure.
The early conversations with researchers, cyclists and civic organisations were revealing. People not only shared how their daily commutes felt, but their stories also pointed to questions the sensors might help answer. Four themes came up again and again: the continuity and quality of cycling infrastructure, how safe it feels to use, overtaking conditions and interactions with motor vehicles, and the gap between the infrastructure that exists on paper and what cyclists experience on the road. The team documented these questions carefully so they could return to them once the data had been collected.
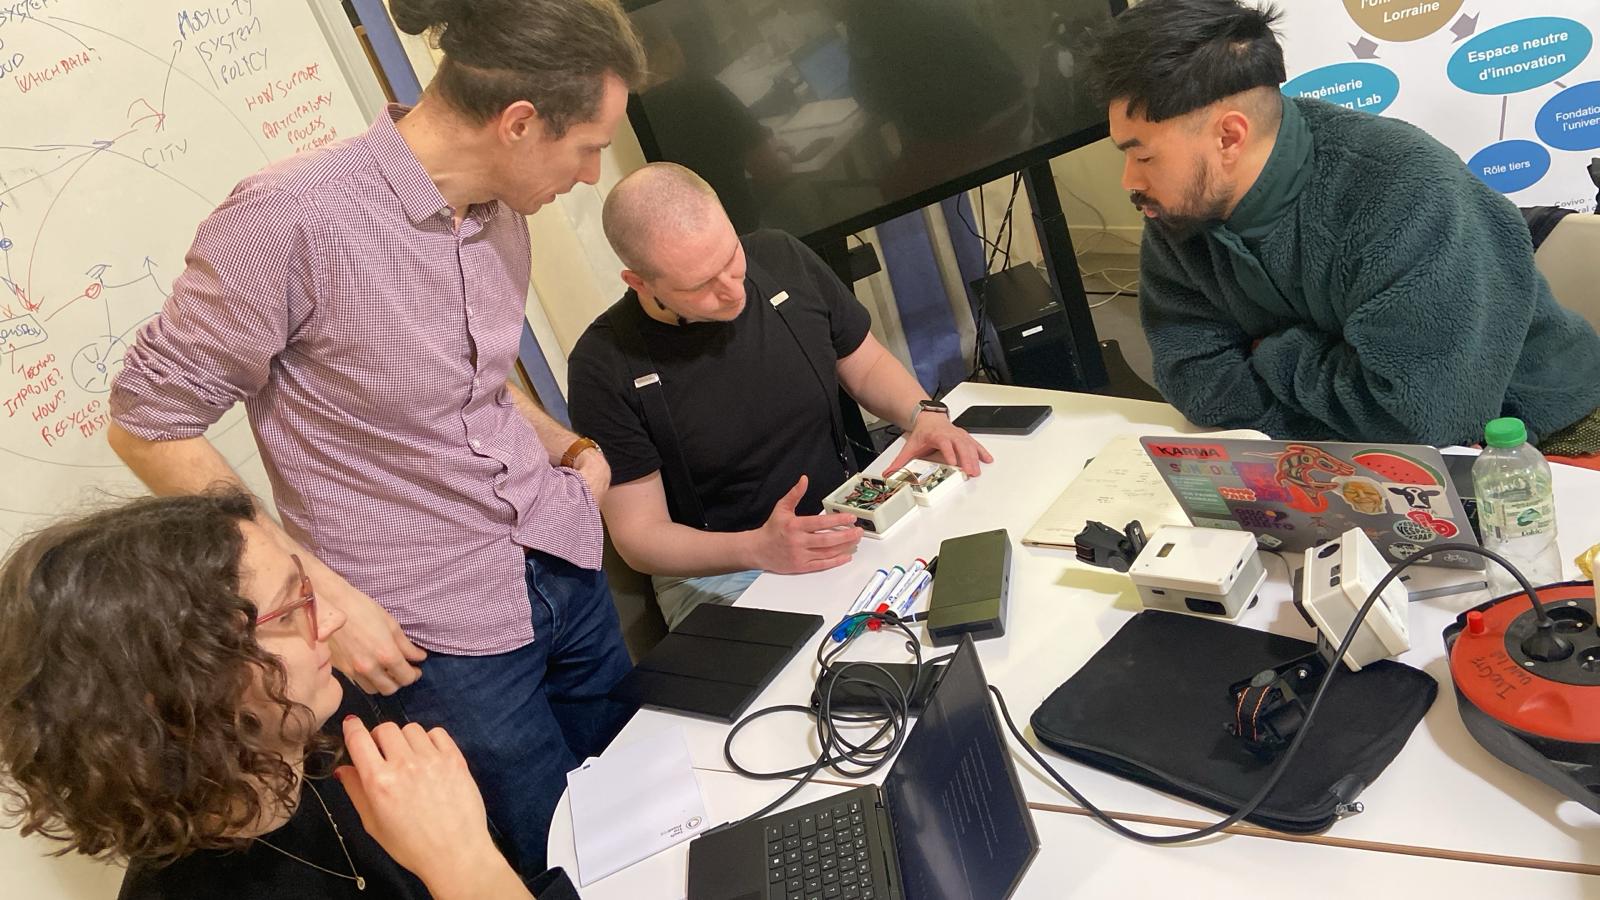
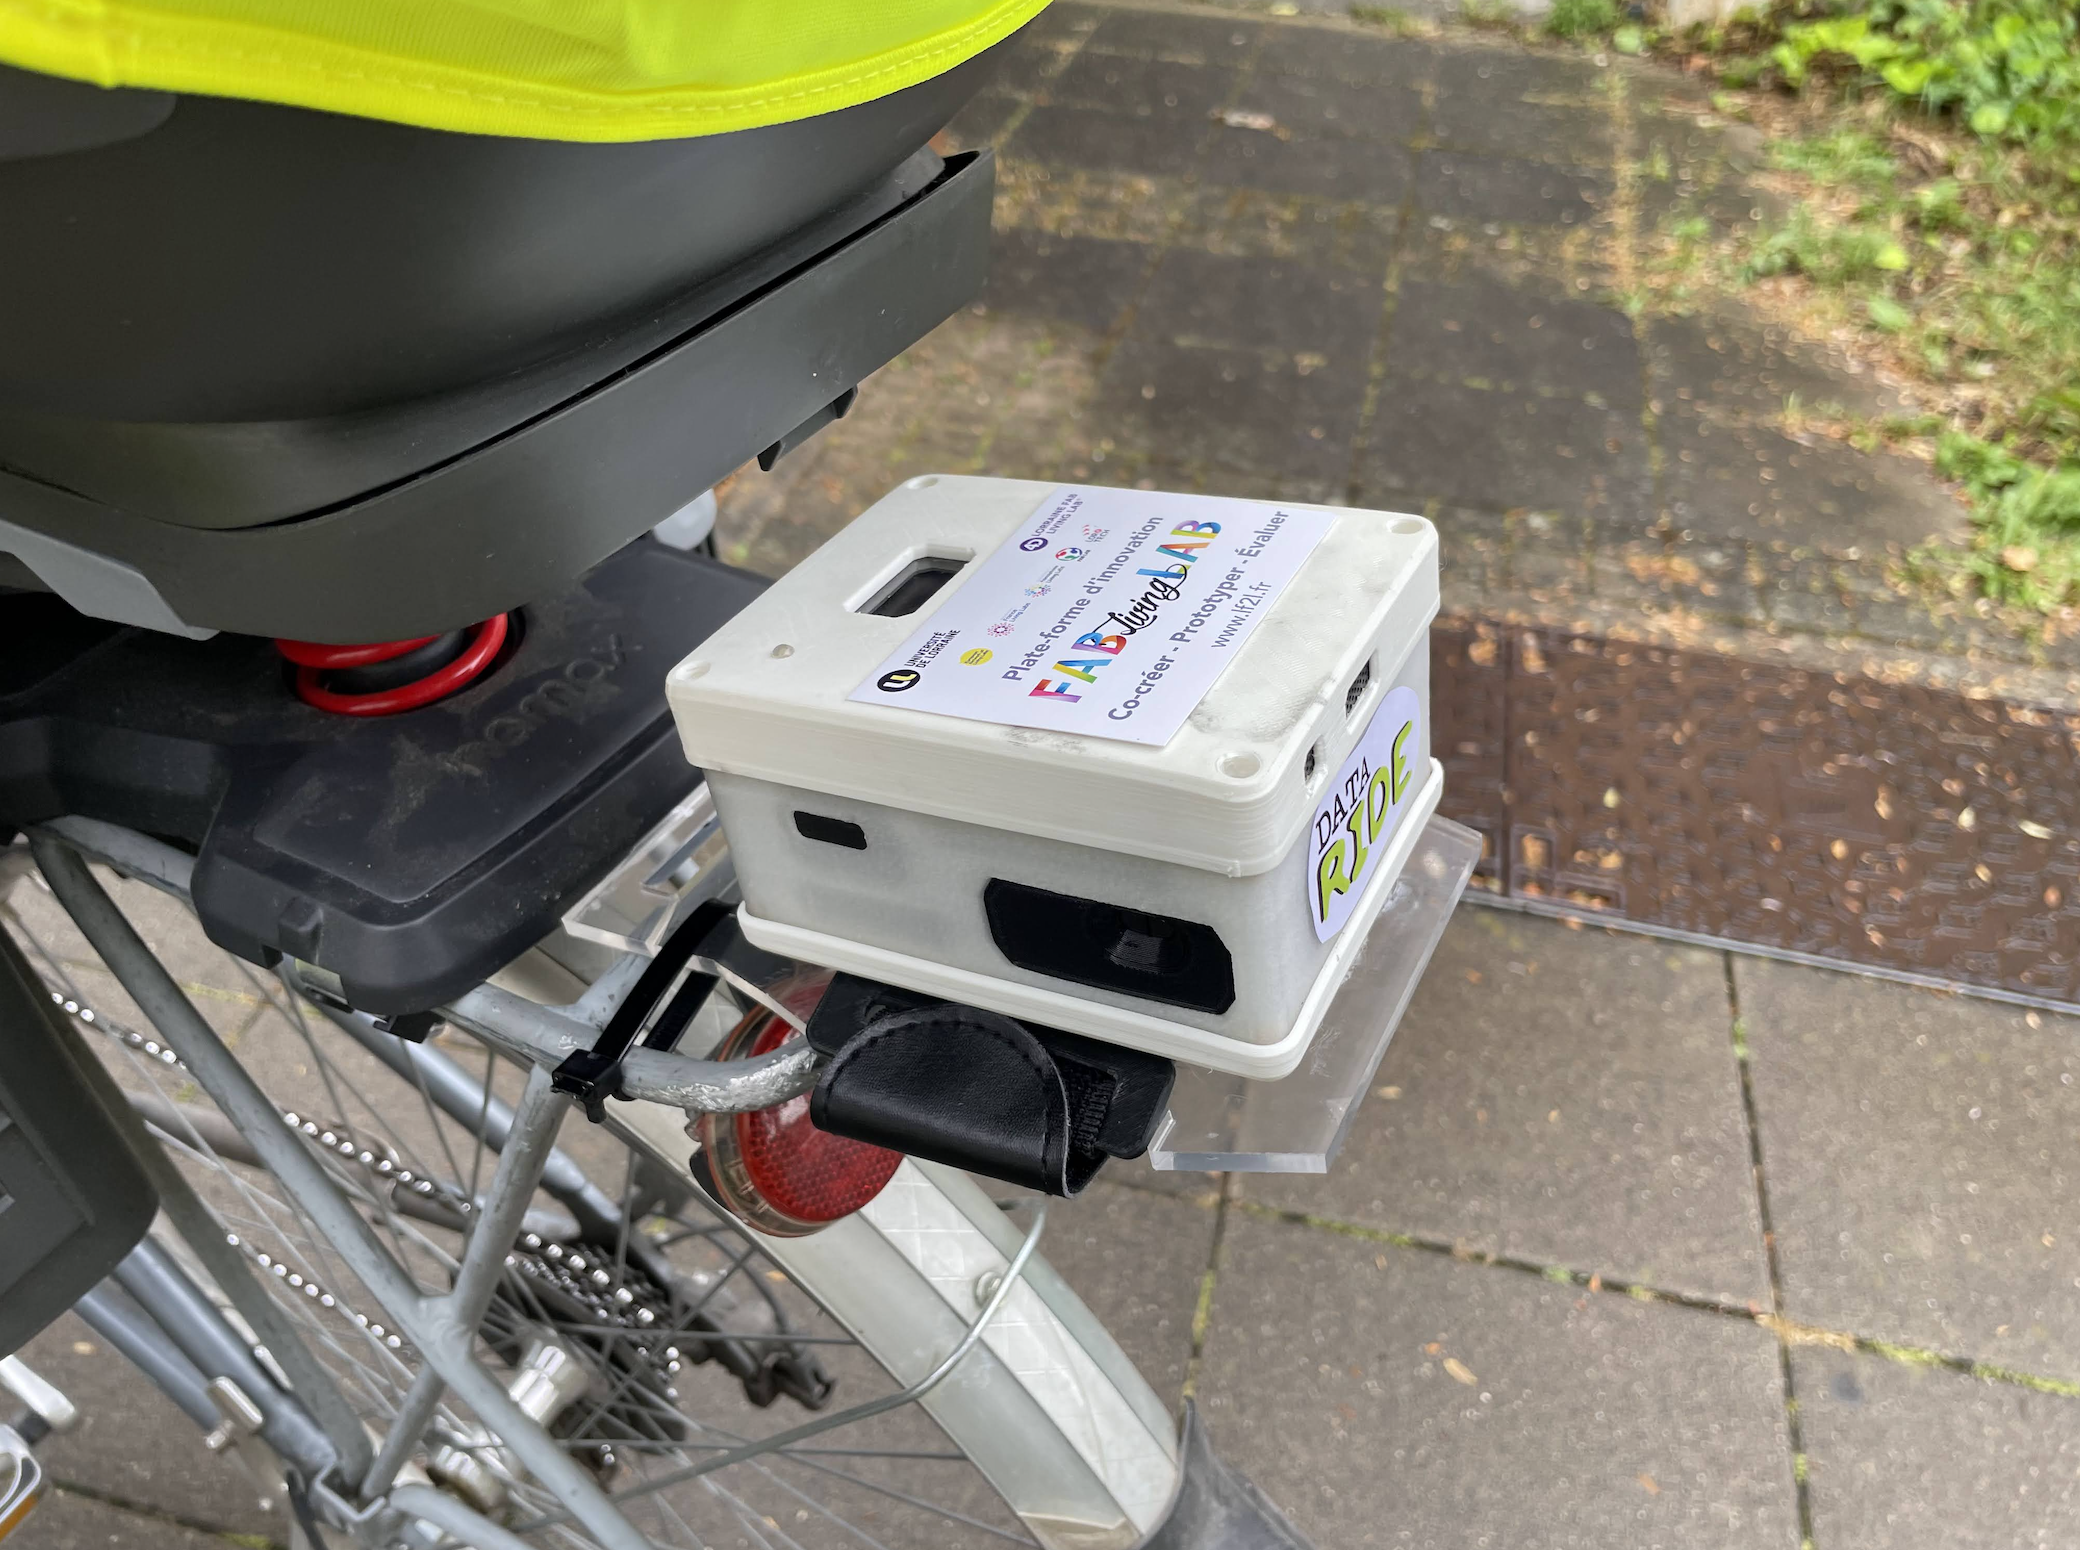
The team then proceeded to present DATA-RIDE and the senseBox:bike device. Showing the hardware inside the device made the technology understandable: which sensors it carries, what data they generate, and how the device connects to the mobile app. The team then connected each measurement to the cycling situations participants had just described, illustrating how an ordinary ride could produce evidence about conditions cyclists often face.
Participants were particularly curious about overtaking distances. Many immediately recognised the situations the sensor would capture, those close passes they knew from their own commutes. Then came the practical part: mounting the senseBox:bikes on participants’ bicycles, connecting them to their phones and testing them. Seeing data appear in real time for the first time was one of the moments that stood out for the team.
Part 2: On the road
Once participants took the sensors out on their daily journeys, also in February, real life quickly taught the team things no workshop could. One of the first requests was to translate the app and supporting information from English into French. The team implemented it within about a week, which gave participants far more autonomy. Different bicycles also exposed the limits of the original mounting system. Bikes with rear child seats, for example, needed an alternative solution, which has since been documented for future deployments.
The first completed data collection round left the team with some great lessons: local adaptation is essential in participatory sensing, and language directly shapes whether people can use the technology independently. Participant feedback proved valuable for improving both the hardware and the campaign method. Moreover, future campaigns will need clearer, more standardised approaches to technical support, calibration and data processing. And the data collection phase confirmed something the team believed from the start: sensor data should never stand alone. It needs to go back to the people who helped generate it.
Part 3: Sharing the results with the community
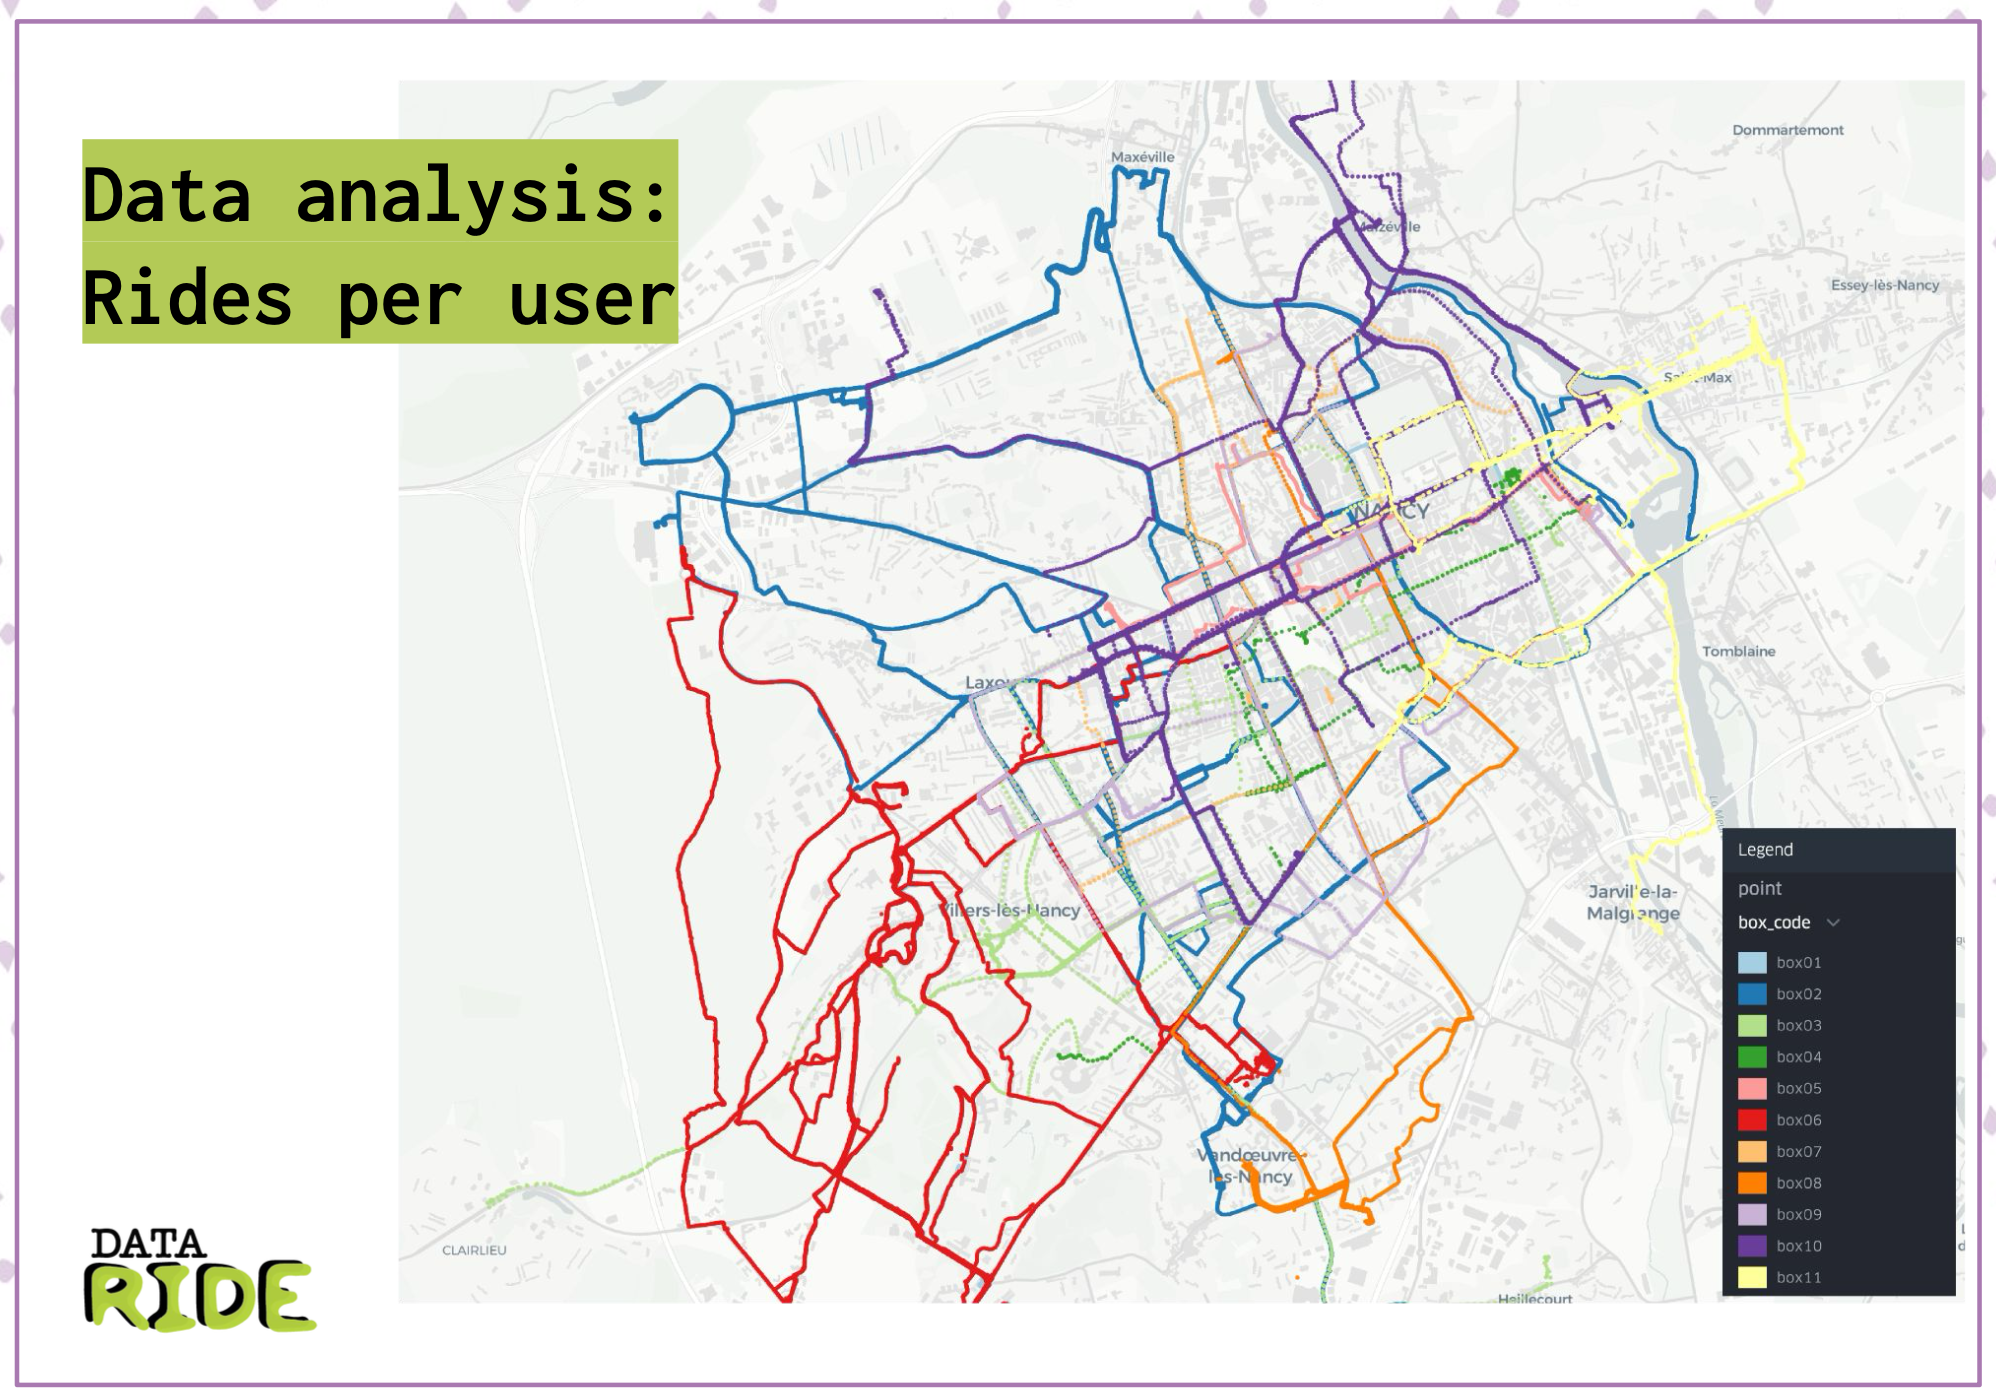
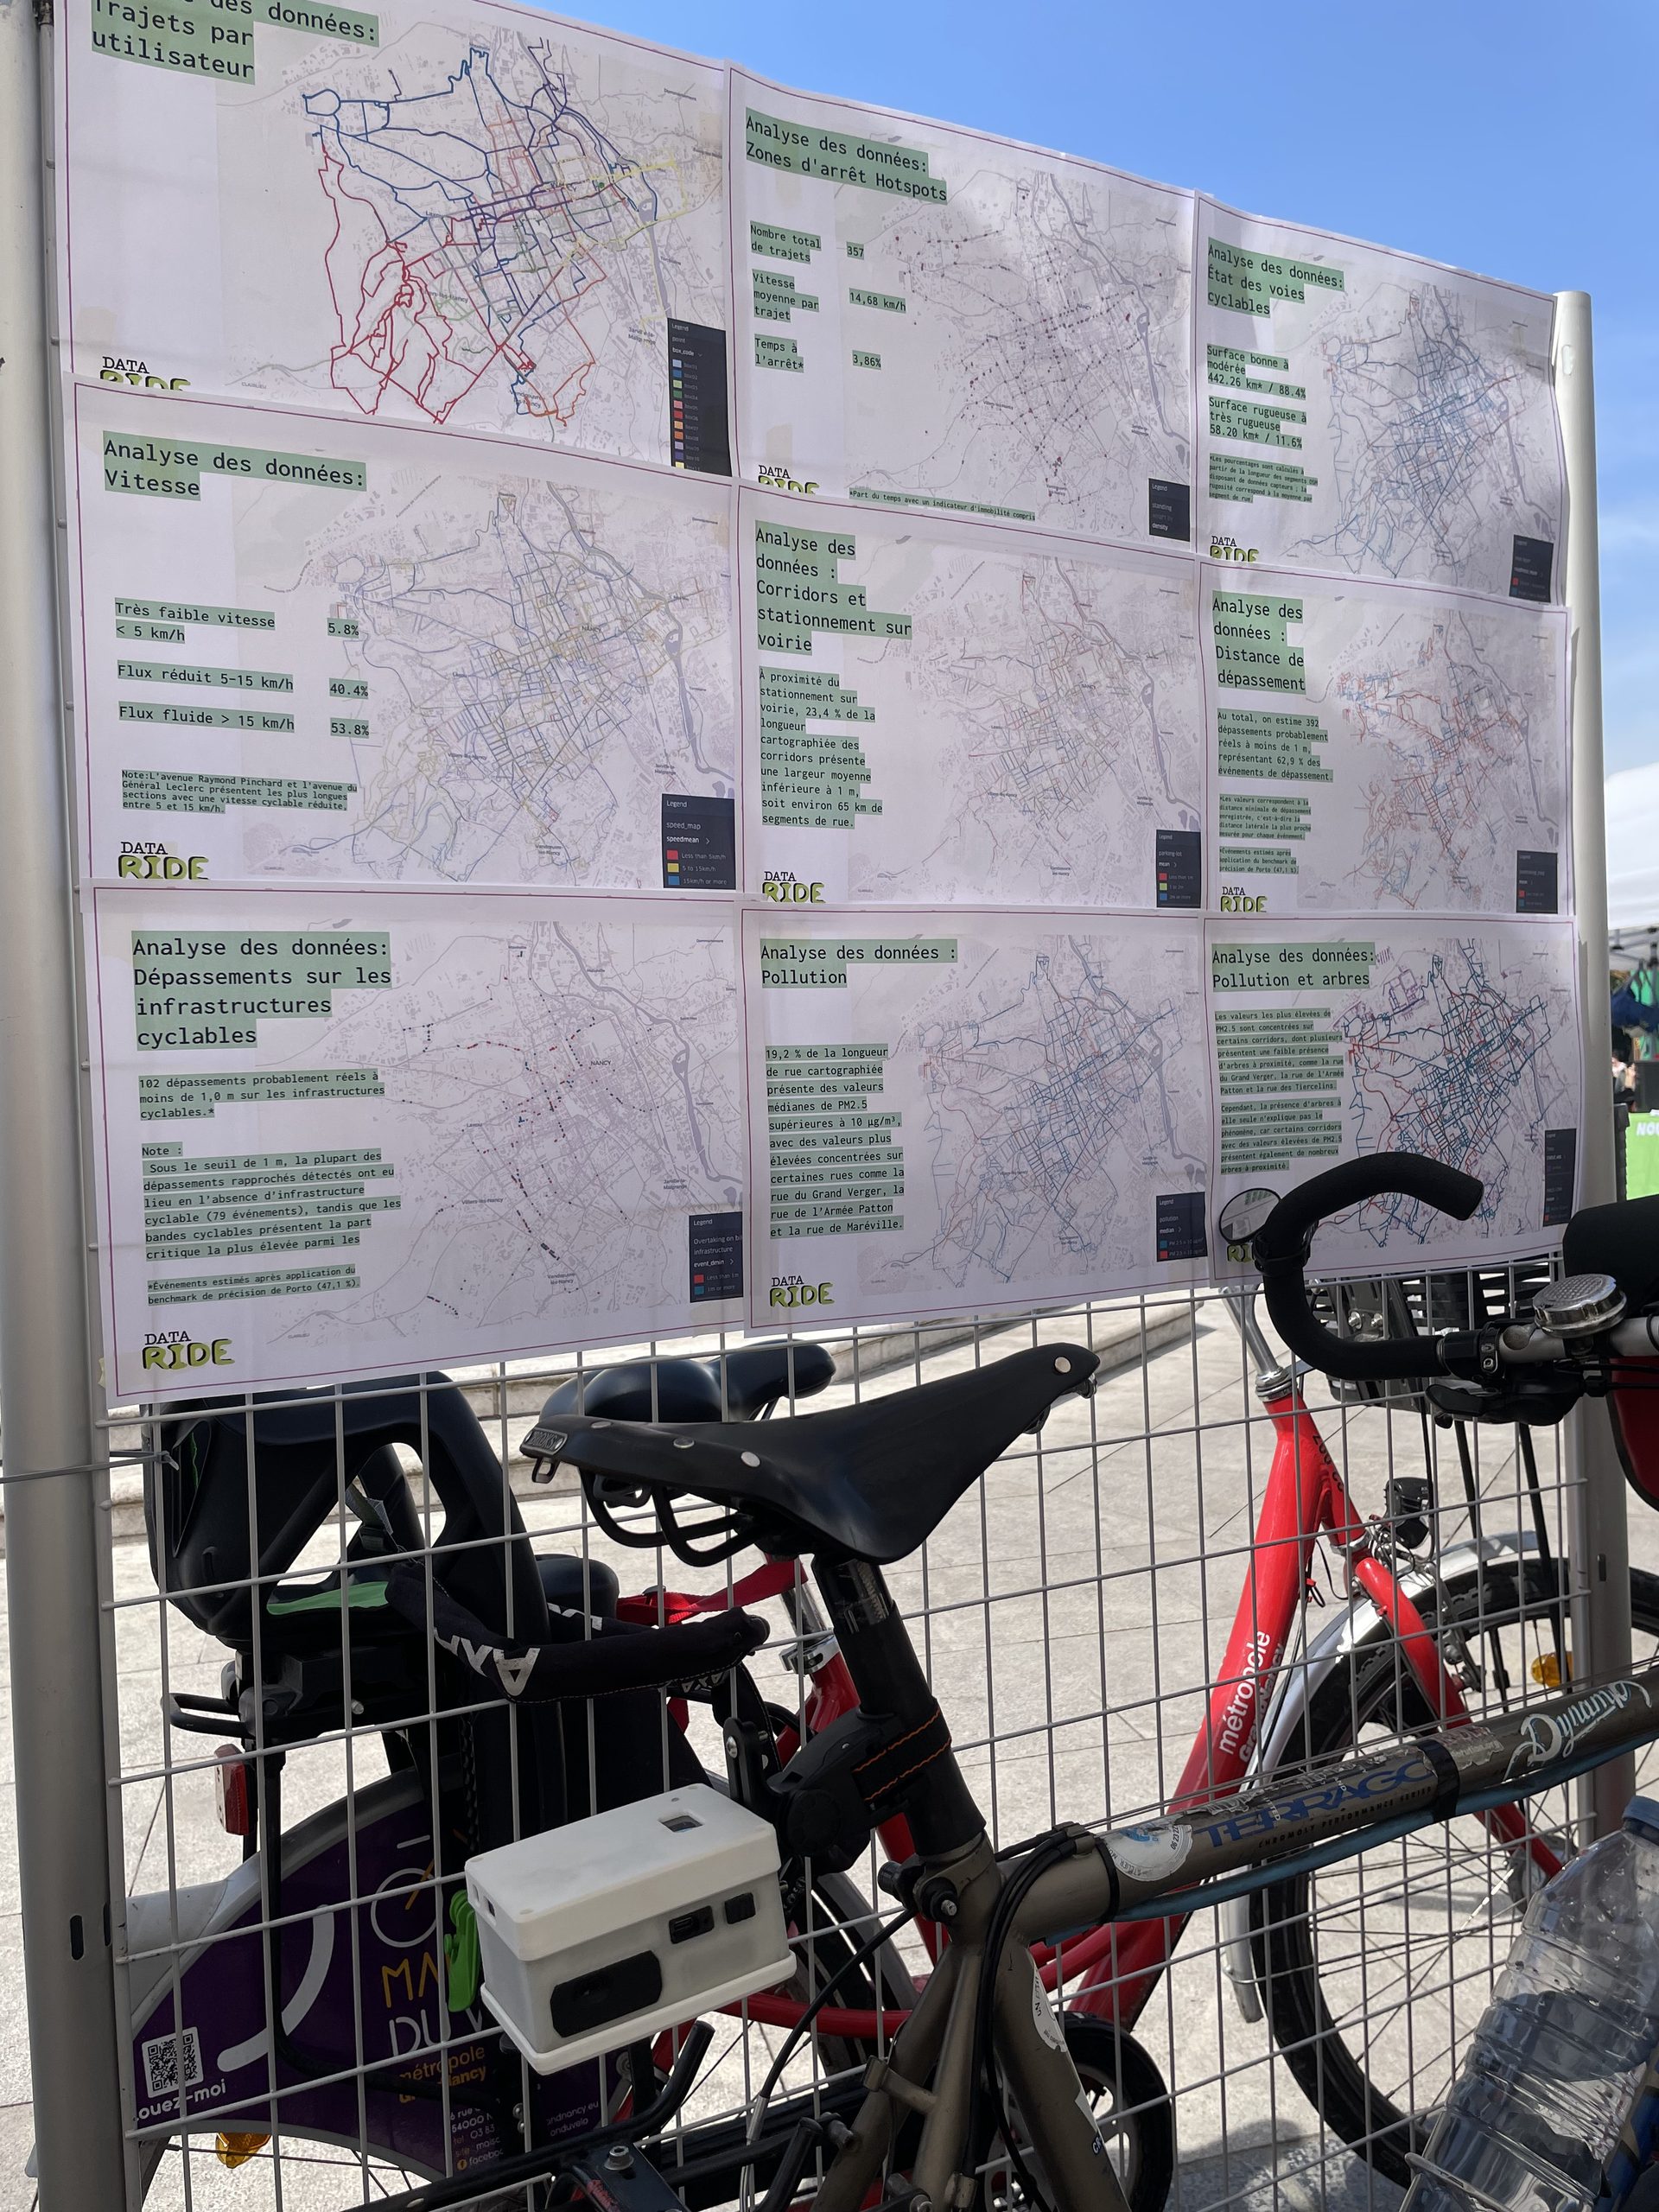
After the collection period, the team analysed the data and turned the results into maps and infographics. Why maps? Maps let cyclists connect measurements to the streets and routes they know by heart, allowing them to spot places where they already felt unsafe, or where overtaking and infrastructure problems occur, and compare what was measured with what they experienced. Infographics then help condense large datasets into clear messages that can be shared publicly, acting as a bridge between data analysis and advocacy.
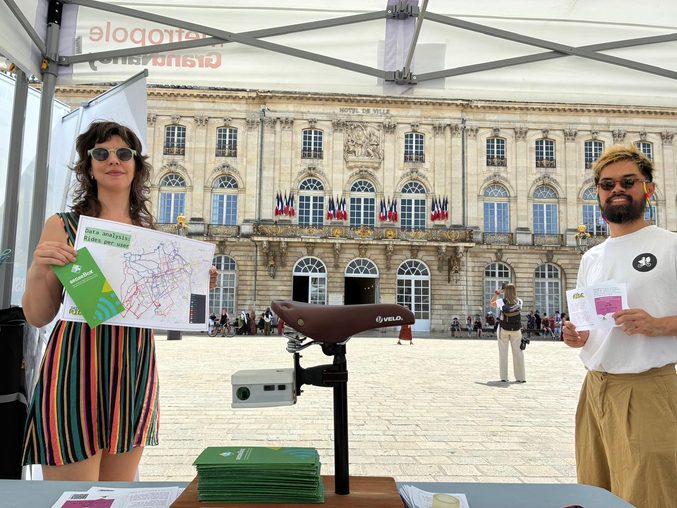
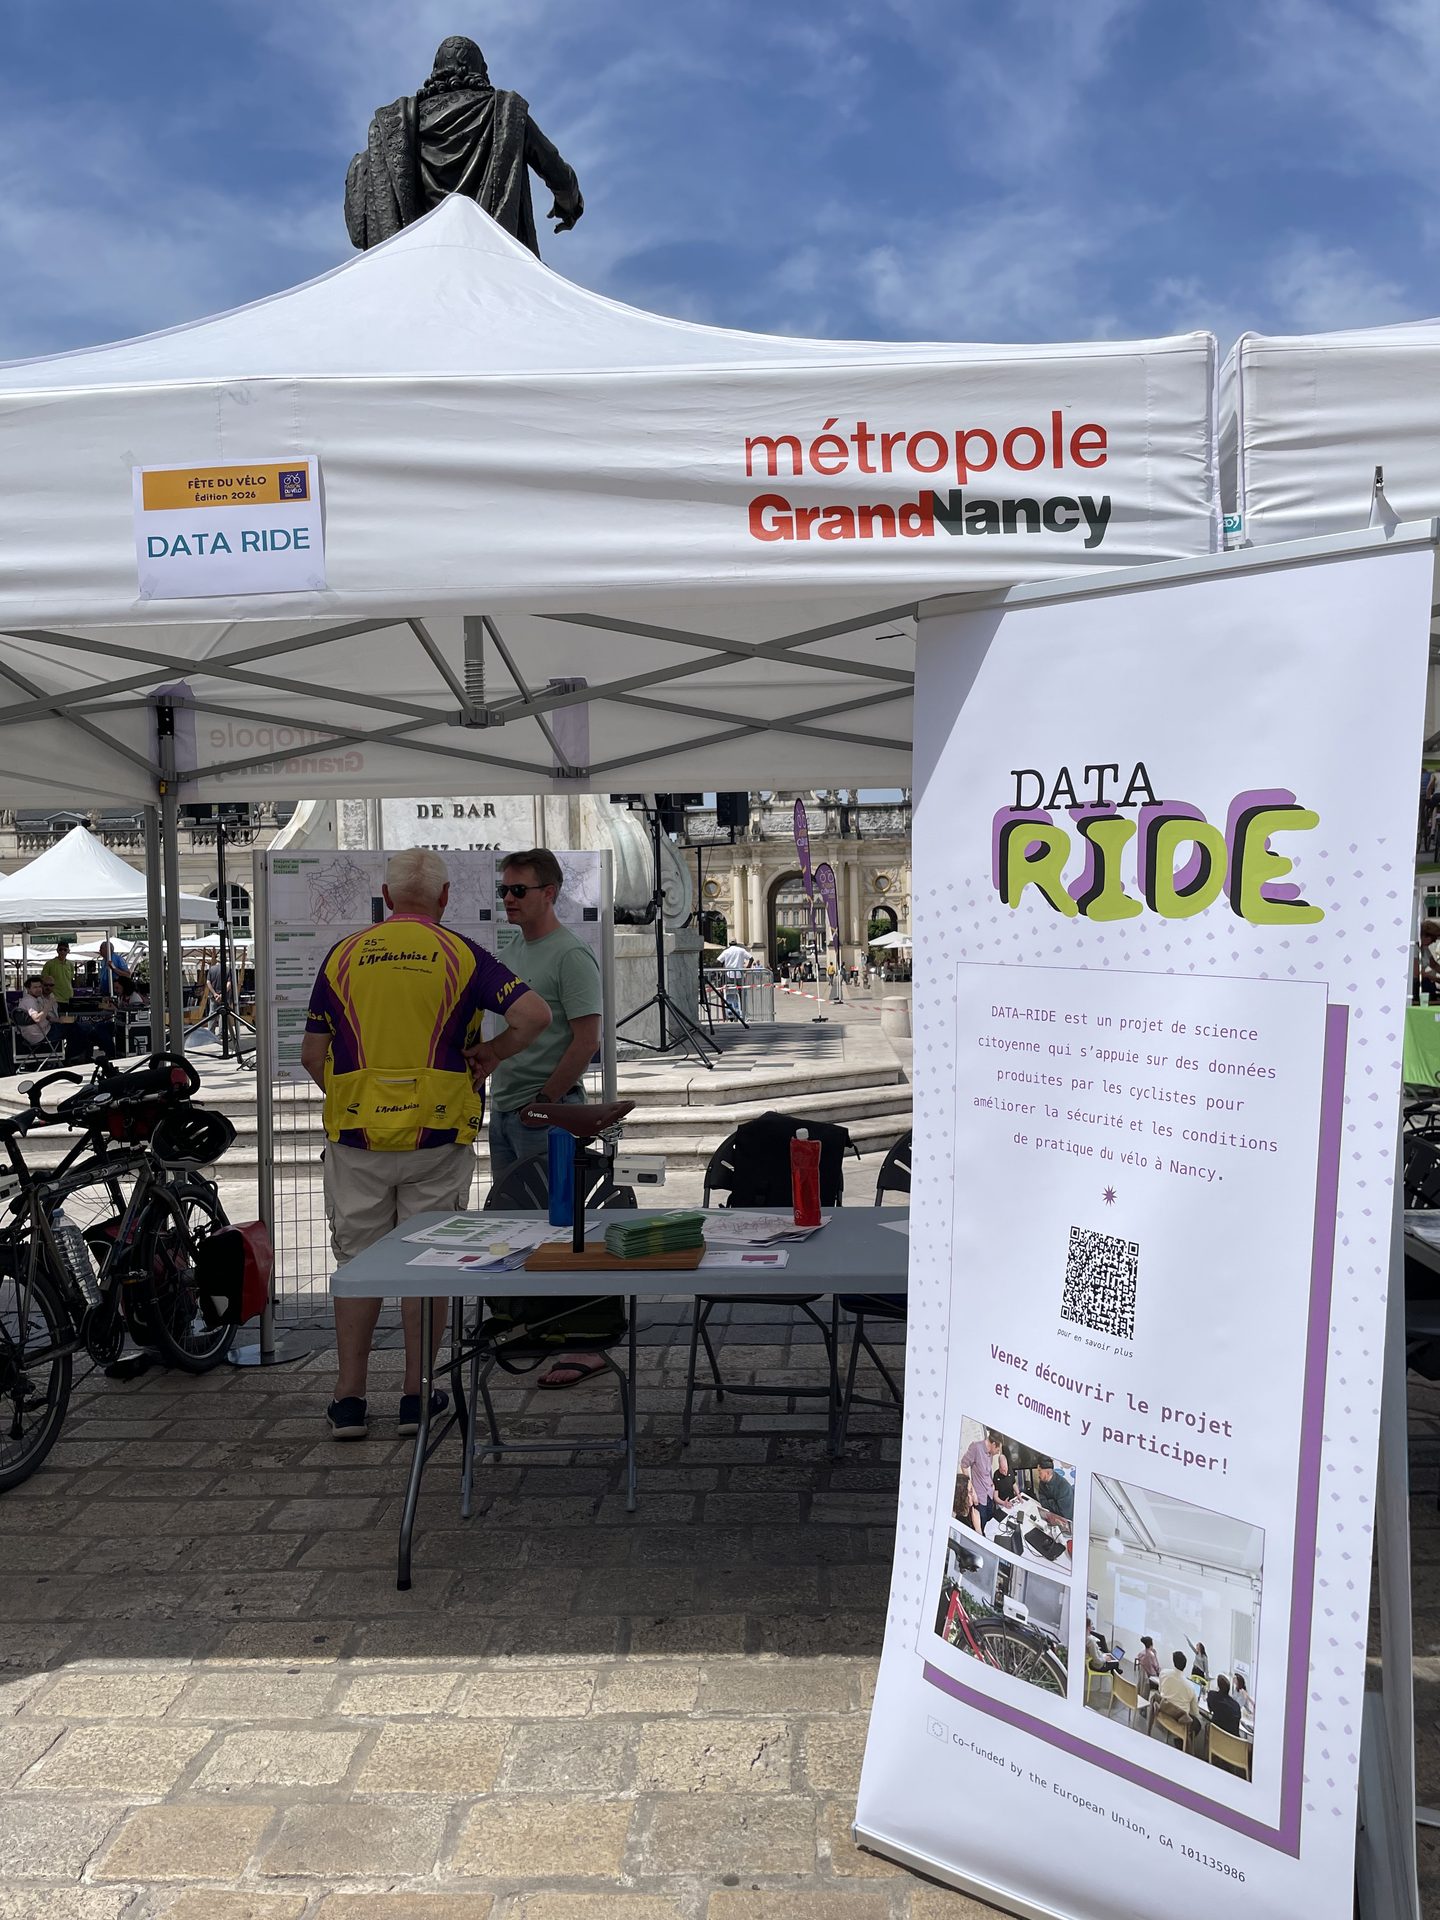
In May, the team presented DATA-RIDE and its first findings at the Fête du Vélo in a public square in Nancy. This opened the project to the wider cycling community, well beyond the original group of participants. The team also held a dedicated workshop with participants to go through the data in more depth, where they returned to the questions raised in February and asked whether the measured patterns matched what people experience every day. Participants helped validate and contextualise the findings, adding what sensors cannot capture, such as whether a situation happens all the time or only at certain hours. They also offered explanations rooted in local knowledge, from parking habits and traffic behaviour to infrastructure design. The conversation then turned to how these findings could support advocacy and dialogue around cycling conditions in Nancy.
This final stage of the project’s citizen engagement efforts is what makes the process meaningful. Combining sensor measurements with lived experience, rather than treating data as self-explanatory, moves participants from being data collectors to co-interpreters and potential users of the evidence.
Cycling forward
The lessons from Nancy showed the team how DATA-RIDE can be a participatory process that runs from identifying local questions to collecting data, analysing results, interpreting them together, communicating the evidence and supporting advocacy.
This experience will certainly shape the project’s future work, whether by improving the senseBox:bike technology or refining the methodology for future campaigns. Alongside the alternative mounting solution and the French-language materials, the team is now planning to define the right duration and scale for data collection. It also aims to build calibration and validation from the very beginning, and make data processing more standardised and reproducible. How findings are discussed with advocacy groups and decision-makers is also something the team hopes to explore in longer engagement processes.
If you are a cycling organisation, researcher or city, the team invites you to adapt and test the approach in your own context. Every bike ride has the potential to tell a story and help create more livable and sustainable urban environments. Follow the DATA-RIDE project activities here.